Hello @Whye_Kit_Fong thanks a lot for your fast repply 
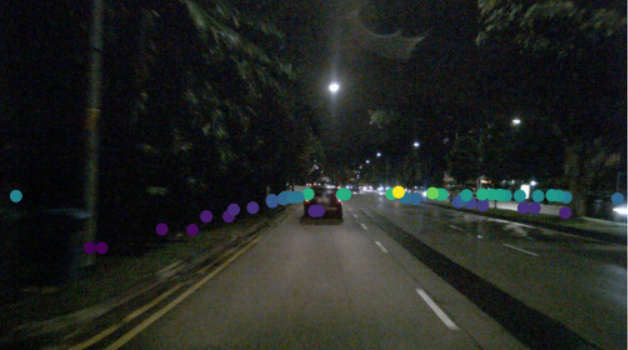
Currently rendering is not my problem, I am able to see it in my tests

However since I’m working with sensor fusion I’d like to retrieve the radar data for each point.
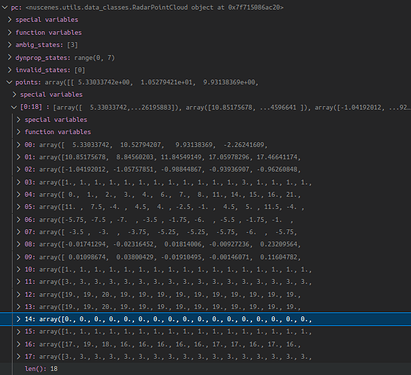
Yesterday, I was able to retrieve somo data for the aformentioned render. Using the following code:
pc = RadarPointCloud.from_file(r’D:\Meus_documentos\Mestrado\YoloV5\yolov5\Nuscene\v1.0-mini\samples\RADAR_FRONT\n015-2018-11-21-19-38-26+0800__RADAR_FRONT__1542800376930984.pcd’)
pc
print(pc)
data = pc.points.astype(dtype=np.float32)
data[8] #vx_comp
data [8] result
array([-3.58403772e-02, -2.03126688e-02, -5.99706881e-02, -1.92602068e-01,
-1.29787654e-01, -1.08094811e-01, -1.60761163e-01, -1.68081820e-01,
-1.53200716e-01, 6.95560500e-03, 1.62855797e-02, -7.63690412e-01,
-8.70206058e-02, -2.51390096e-02, -5.29952794e-02, 1.07711062e-01,
9.47757959e-02, 7.22977892e-02, 6.29804730e-02, -7.71299228e-02,
-1.39897794e-01, -8.00487709e+00, -6.68413788e-02, -1.76215827e-01,
-8.01043606e+00, -2.18048826e-01, -1.75610170e-01, -2.05206964e-02,
-1.11219704e-01, -8.67524967e-02, 1.66111551e-02, -6.11628354e-01,
6.36762381e+00, -2.64386870e-02, -1.25792101e-01, -7.53235668e-02,
-1.89500839e-01, 1.23721160e-01, -1.45851478e-01, 1.53933197e-01,
-1.75075065e-02, -1.93948984e-01, 1.19011986e+00, -2.14846954e-02,
-1.95859700e-01, -2.44484609e-03, -7.49484301e-02, -4.73330617e-02,
-2.15848405e-02, -8.20530701e+00, -1.26934737e-01, -4.04719748e-02,
-9.72509459e-02, 1.86158910e-01, -2.65236162e-02, -2.19446599e-01,
-1.51756510e-01, -5.30254096e-02, 6.37596846e-01, -8.37158039e-02,
-5.10084853e-02, -1.06322713e-01, -9.48221460e-02, -1.42176643e-01,
-1.38736412e-01, -1.05555907e-01, -5.14228716e-02], dtype=float32)
But, I cannot associate the velocity with the specific point and more than that how can I related this to the rendered image…
Thank you in advance!


 here’s a code snippet that you could take inspiration from as well:

